Embed a floor plan in your page
With a frontend SDK
The easiest way to show a chart is to use one of our frontend SDKs:
- React: https://github.com/seatsio/seatsio-react
- Vue: https://github.com/seatsio/seatsio-vue
- Angular: https://github.com/seatsio/seatsio-angular
- React-native: https://github.com/seatsio/seatsio-react-native
- Flutter: https://github.com/seatsio/seatsio-flutter
- Android: https://github.com/seatsio/seatsio-android
- iOS: https://github.com/seatsio/seatsio-ios
Without a frontend SDK
If we don't offer an SDK for your frontend framework, you can embed a chart using plain HTML and JS.
Insert one of following scripts in your HTML page (for instance inside
<head>) based on your account region:- Europe:
<script src="https://cdn-eu.seatsio.net/chart.js"></script> - North America:
<script src="https://cdn-na.seatsio.net/chart.js"></script> - South America:
<script src="https://cdn-sa.seatsio.net/chart.js"></script> - Oceania:
<script src="https://cdn-oc.seatsio.net/chart.js"></script>
- Europe:
Add an empty element to your page to act as a container for the embed, for instance:
<div id="chart"></div>Add the following snippet at the end of the HTML page:
<script>
    new seatsio.SeatingChart({
        divId: 'chart',
        workspaceKey: 'PUBLIC_WORKSPACE_KEY',
        event: 'EVENT_KEY'
    }).render();
</script>
Where:
PUBLIC_WORKSPACE_KEYis your public workspace key, found at your accounts Workspace Settings.EVENT_KEYis the floor plans event you want to display.
Below you will find a live example of this.
Type definitions
As of October 2023, we ship our own type definitions package for Seats.io, @seastsio/seastsio-types. If you have been using @types/seatsio, that package is now deprecated and we recommend that you switch to the new package.
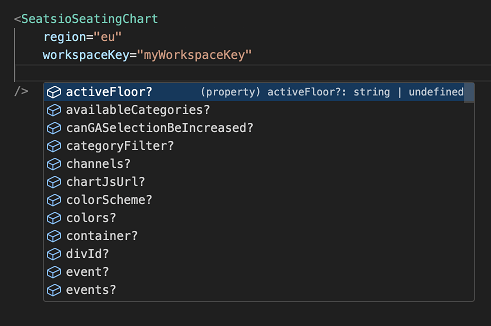
If you use our React SDK, we ship that with types from version 14 onwards. Your IDE should automatically pick up on those and provide suggestions:

Install types manually
If you have a TypeScript project and you are using Seats.io without a frontend SDK, you can add the typings yourself:
- Install
@seatsio/seatsio-typesas a dev dependency - In your
tsconfig.jsonfile, make sure thattypeRootsincludes"node_modules/@seatsio/seatsio-types"
That's it! You should now be able to use Seats.io with type checks and suggestions.